Due to COVID-19, the case of COVID-19 is increasing every day in Australia. Chinese and Chinese students living in Australia are worried about that. In this case, CBRLife created a real-time statistics system in Chinese. Provide Chinese users with real-time statistics on COVID-19 in Australia.
Client requirements
Make a template version and poster, banner for COVID-19 statistics. The final statistics will be showed on Mini app. This includes the current number of confirmed cases in all regions of Australia, and the daily increase in confirmed cases. Show it by map, pie chart or line chart.
It is similar as what i did in infographic class. The difference is, this time I only need to make a template design. The technician will make the real-time statistics based on my design.


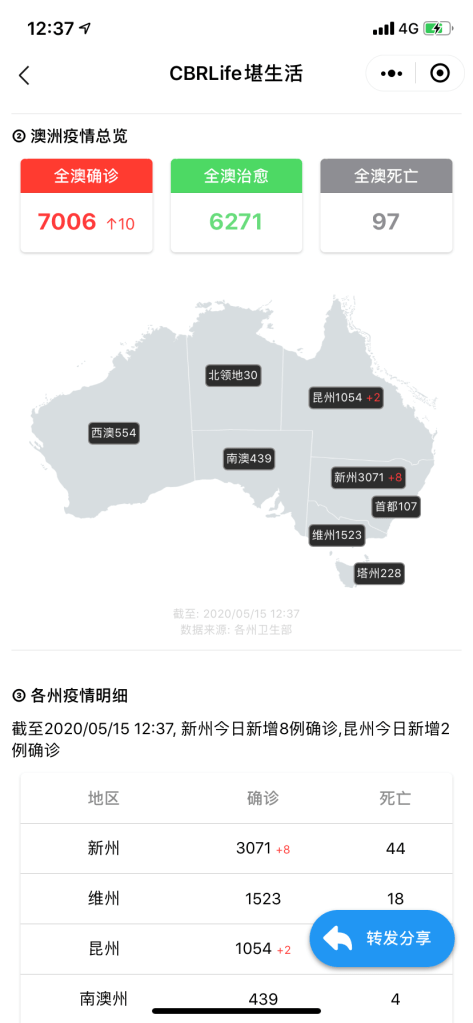
Table and Map Version at Mini app 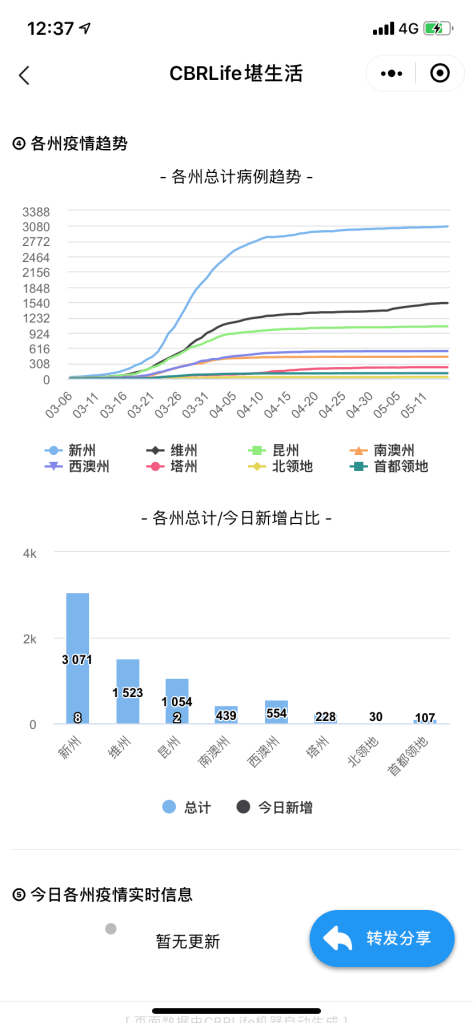
Bar chart and Line chart version at Mini app
